Updated Index · version 2.1
MNBC Experimental Index of Public and Consumer Sentiment
The index combines three published indicators that capture different sides of public sentiment: the country’s long-term future, assessments of its current direction and consumers’ views. MNBC chose the components, equal weights and the rules for conversion and presentation. We did not conduct a survey of our own or use individual questionnaires.
 Project leadMariia KovalchukData analyst

- Method
- CATI
- Geography
- Ukrainian-controlled territory
- Population
- Adult citizens (Info Sapiens: aged 16+)
- Commissioned by
- MNBC initiative
- Published
- 10.11.2026
Key findings in 30 seconds
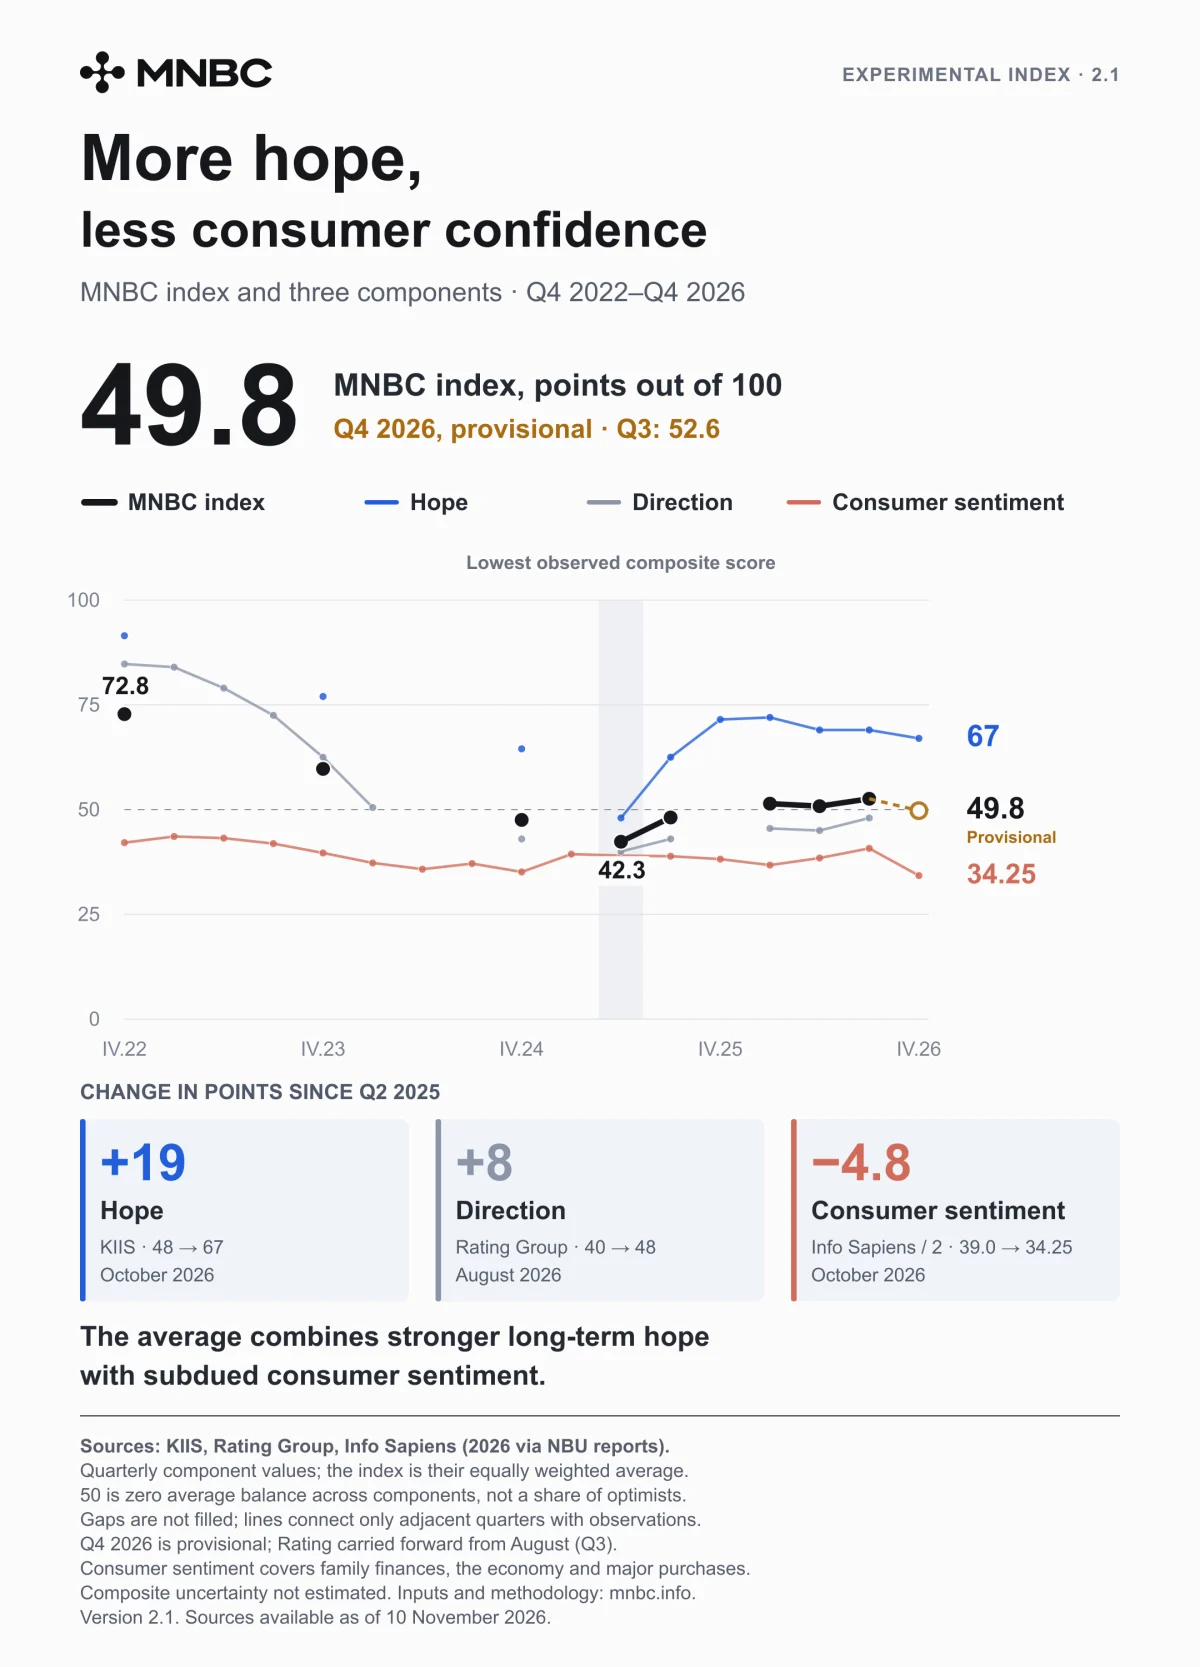
- 49.8points out of 100: the preliminary estimate for Q4 2026. The Rating Group value is carried over from August.
- 52.6points in Q3 2026, the latest quarter with data from all three sources.
- +19points: the rise in the hope component (KIIS) from Q2 2025 to October 2026.
- −4.8points: the fall in the consumer component (Info Sapiens) over the same period. The average hides this gap.
This is a descriptive, experimental indicator. It is not a validated psychological scale or official statistics. It should be read together with its three components and the dates on which each was measured.
Current result
The preliminary estimate for the fourth quarter of 2026 is 49.8 points out of 100. It uses October data from KIIS and Info Sapiens and carries forward Rating Group's latest value from August. The quarter is not over yet, and it contains no Rating Group measurement for the same question.
The most recent quarter with observations from all three sources is the third quarter of 2026, at 52.6 points. Having all three components means there is enough data for our calculation rule; it does not mean sentiment was measured continuously on every day of the quarter.
Three components
- KIIS: choice of scenario for Ukraine ten years from now. Conversion: 50 + (optimistic − pessimistic answers) / 2. Value used: 67.0 (October 2026).
- Rating Group: whether things in the country are going in the right or the wrong direction. Conversion: 50 + (right − wrong direction) / 2. Value used: 48.0 (August 2026, carried forward).
- Info Sapiens: Consumer Sentiment Index (CSI). Conversion: CSI / 2. Value used: 34.25 (October 2026).
In the first two formulas, shares are entered as percentages, for example 61 and 27. The CSI is published on a 0–200 scale, so dividing it by two keeps the zero-balance point at 50 on the new scale.
The CSI is itself an average of five indicators. It covers the change in the household's financial situation over the past six months, expectations for the next six months, the outlook for the national economy over one year and five years, and whether now is a good time for major purchases. Our construction therefore combines forward-looking, current and retrospective assessments. That is why the name refers to "sentiment" rather than just "expectations".
Formula and weights
MNBC Index = (KIIS on the 0–100 scale + Rating Group on the 0–100 scale + CSI / 2) / 3.
Each of the three components receives a weight of 1/3. This is an editorial choice that gives the three sources equal nominal weight. The weights were not estimated statistically or chosen to predict GDP, migration or well-being. Equal weights also do not guarantee that the components contribute equally to movements in the result.
Sample size is not used as a measure of a component's importance. The CSI counts as one component, not as five additional sources.
Current calculation:
(67 + 48 + 68.5 / 2) / 3 = 49.75 ≈ 49.8.
Calculations use the full precision of the published inputs. Only the displayed result is rounded to one decimal place. The underlying shares and indices have already been rounded by their publishers.
How to read the scale
- Above 50: a positive average balance across the selected set of indicators.
- Below 50: a negative average balance across this set.
- 50: a zero average balance across the components.
This is not the share of optimists, the probability of a better future or the view of a typical respondent. Different components can offset one another. For example, the current composite score of around 50 combines a value of 67 for the long-term future with 34.25 for consumer sentiment.
In the KIIS and Rating Group balances, "hard to say" answers are added to neither the positive nor the negative share. When the categories add up to exactly 100%, this is equivalent to scoring undecided answers at the midpoint of 50. It is an accounting rule, not an assumption that undecided respondents are psychologically neutral.
Quarterly rules
- Each wave is assigned to the quarter of its fieldwork. Where only the month is known, we use that month's quarter. For waves that straddle two quarters, we use the midpoint of the known fieldwork period. Under this rule, September 19 to October 5, 2025, falls in the third quarter. The publication date never stands in for the survey date.
- If a source has several waves in a quarter, we take the simple average of its converted values. We then average the three components, not all the waves together. More waves do not increase a source's nominal weight.
- The main historical index is calculated only when all three components have observations in a given quarter. A missing value is not treated as zero. All other quarters are marked "insufficient data".
- There is no linear interpolation between distant waves. On the chart, periods without data remain as gaps, and only adjacent quarters with calculated values are connected.
A quarter is a unit for grouping the available waves. It is not an estimate of average sentiment on each calendar day of the quarter. Before 2026, the consumer component is usually an average of three monthly values; in 2026 it is a single quarterly update. This change in frequency limits comparability, and the formula alone does not remove that limitation.
Separate rule for the preliminary estimate
For the latest, unfinished quarter, we allow a separate preliminary snapshot if two components have already been measured and the third is available for the immediately preceding quarter. A value may be carried forward for one quarter only. Such an estimate is not recorded as an observed historical index value and always has a separate status.
As of November 10, 2026, the fourth quarter meets this condition: for Rating Group we use 48.0 points from August 4–9. If no new measurement appears, that will not be evidence that sentiment has stayed the same.
Once a quarter ends, a value for the main series is published only if all three components have been measured. Otherwise the quarter remains incomplete, and the preliminary snapshot is kept as a labeled archive estimate. The old value is not carried forward a second time into the next quarter.
Historical values
Below, "data from all three sources" means each source has at least one wave in the quarter. "Preliminary" marks the separate snapshot with Rating Group carried forward. No historical gap has been filled by interpolation.
Quarter: composite score (KIIS, Rating Group, Info Sapiens / 2)
- 2022Q4: 72.8 (KIIS 91.5, Rating 84.8, Info Sapiens / 2 42.1)
- 2023Q1: insufficient data (KIIS —, Rating 84.0, Info Sapiens / 2 43.6)
- 2023Q2: insufficient data (KIIS —, Rating 79.0, Info Sapiens / 2 43.2)
- 2023Q3: insufficient data (KIIS —, Rating 72.5, Info Sapiens / 2 41.9)
- 2023Q4: 59.7 (KIIS 77.0, Rating 62.5, Info Sapiens / 2 39.6)
- 2024Q1: insufficient data (KIIS —, Rating 50.5, Info Sapiens / 2 37.3)
- 2024Q2: insufficient data (KIIS —, Rating —, Info Sapiens / 2 35.8)
- 2024Q3: insufficient data (KIIS —, Rating —, Info Sapiens / 2 37.1)
- 2024Q4: 47.5 (KIIS 64.5, Rating 43.0, Info Sapiens / 2 35.1)
- 2025Q1: insufficient data (KIIS —, Rating —, Info Sapiens / 2 39.4)
- 2025Q2: 42.3 (KIIS 48.0, Rating 40.0, Info Sapiens / 2 39.0)
- 2025Q3: 48.1 (KIIS 62.5, Rating 43.0, Info Sapiens / 2 38.9)
- 2025Q4: insufficient data (KIIS 71.5, Rating —, Info Sapiens / 2 38.2)
- 2026Q1: 51.4 (KIIS 72.0, Rating 45.5, Info Sapiens / 2 36.8)
- 2026Q2: 50.8 (KIIS 69.0, Rating 45.0, Info Sapiens / 2 38.5)
- 2026Q3: 52.6 (KIIS 69.0, Rating 48.0, Info Sapiens / 2 40.8)
- 2026Q4: 49.8* (KIIS 67.0, Rating —, Info Sapiens / 2 34.25): preliminary, Rating Group carried forward
There is no observed Rating Group value for the fourth quarter. The separate 49.8 estimate uses the August value of 48.0. Overall, the main series has eight quarters with data from all three sources, while eight quarters lack sufficient data. For the latest, seventeenth quarter, a preliminary snapshot is shown.
What drove the latest change
Between the third quarter and the preliminary fourth-quarter estimate of 2026, the consumer component falls from 40.75 to 34.25 points and the KIIS component from 69 to 67. The carried-forward Rating Group value stays at 48 because of the calculation rule, not because of a new survey.
The average changes by about −2.83 points: Info Sapiens contributes −2.17, KIIS −0.67 and Rating Group 0. Roughly 76.5% of this change comes from the consumer component. This is an arithmetic decomposition, not a causal explanation of change in society. It does not justify claiming that all three dimensions deteriorated at the same time.
A simple scenario shows how sensitive the preliminary estimate is to the next Rating Group value:
- Rating 43 → composite score 48.1
- Rating 48 → composite score 49.8
- Rating 53 → composite score 51.4
This is not a forecast, a confidence interval or a list of equally likely outcomes. The values only illustrate sensitivity to the carry-forward, so the fact that the current estimate sits slightly below 50 should not be overstated.
Comparison with the second quarter of 2025
The article and the infographic show the change from the second quarter of 2025 to the latest values used. For KIIS and Info Sapiens that is October 2026; for Rating Group it is August. In each case the baseline is the quarterly value calculated under the same wave-averaging rule.
- KIIS: 48.0 → 67.0, a change of +19.0 points
- Rating Group: 40.0 → 48.0, a change of +8.0 points
- Info Sapiens / 2: 39.0167 → 34.25, a change of −4.7667 ≈ −4.8 points
The value of 42.3 for the second quarter of 2025 is the lowest among the eight quarters with data from all three sources. Because of the missing quarters, it cannot be called the absolute low for the whole period. Component changes are given in points on the normalized scales; they are not percentage changes in income or in the share of optimists. On the chart, all four series are shown by quarter, not as a mix of monthly waves and quarterly averages.
Why there is no confidence band
We do not publish a 95% confidence interval for the composite index or test small differences for statistical significance. There is not enough information about the design of every wave, shared errors or the covariances of the CSI's five sub-indicators. Without that information, there is no sound basis for such a calculation.
The absence of a band on the chart does not mean zero error. Survey errors, rounding, changes in the population that can be reached and our own choice of components all remain. Any interpretation should take these limitations into account.
Index sources and verification
KIIS. Current release with the historical chart (in Ukrainian). October 2026 wave: October 8–16; 1,031 citizens aged 18+; CATI using random mobile numbers, with weighting. It does not cover occupied territories or those who left the country after February 24, 2022. Shares for historical waves were checked against the chart. The current sample size is not assumed for earlier waves. For the wave that straddles two quarters, September 19 to October 5, 2025, we checked the dates and the 1,008 participants; for November 26 to December 29, 2025, 1,001 participants (both in Ukrainian).
Rating Group. August 2026 report and full PDF (in Ukrainian). Page 45 contains the history of answers on the right or wrong direction; page 2 describes the method. Current wave: August 4–9, 2026; 2,000 people aged 18+; CATI RDD with weighting, excluding occupied territories and areas without Ukrainian mobile coverage. All 16 pairs of shares used were checked. The October report contains different questions about the coming winter; we do not use them as a substitute for this component.
Info Sapiens. Example of a primary release and description of the method (in Ukrainian). We checked 39 monthly values from October 2022 to December 2025 against the publisher's pages. The sample described there is 1,000 people aged 16+, surveyed by telephone; this is a different age group from the 18+ used by the other two sources. For 2026 we use January 73.5, April 76.9, July 81.5 and October 68.5 from the NBU's July report, p. 21, footnote 19 and its October report, p. 18, footnote 15 (in Ukrainian). The NBU does not give sample sizes for these four waves in those places, and we do not assume a confirmed n of 1,000 for them. The switch to quarterly frequency is also noted in the CES tracker.
In total, 69 published waves were used: 10 from KIIS, 16 from Rating Group and 43 from Info Sapiens.
Limits of the conclusions and update rules
The components refer to different populations and time horizons; they are combined as an external, descriptive indicator. They do not form a common sample and do not show how views combine within one person. Sample sizes and methods, coverage during the war and publication frequency may change. This release is a retrospective snapshot of the sources available, not proof that the index can predict events in real time.
The index does not measure clinical anxiety, exhaustion, family intentions or willingness to migrate. The article draws on separate studies for those topics. A negative average balance does not represent the percentage of "pessimists in society".
New waves are added with a link to the primary source and the fieldwork period, after which the quarters are recalculated with the same formula. Each release states the snapshot date, the status of the preliminary estimate and the list of revised periods. Any change to a source, question wording, weights or carry-forward rules requires a new version of the methodology. Errors are corrected transparently, and the previous release is archived.
Version 2.1 replaces the single-component indicator used in the first edition of the article. Their levels are not directly comparable: the difference between 67 in the old construction and 49.8 in the new one is not a measured decline in sentiment.
Sources for the other sections of the article
The studies below, used in our analysis "A society of fatigue", provide context on everyday life, work, moving and family plans. They are not additional components of the index.
Institute of Sociology, National Academy of Sciences of Ukraine, July 2026
Research presentation, wave 1. National Academy of Sciences news release (both in Ukrainian).
July 21–25; 432 adults; CATI using a random sample of mobile numbers, excluding occupied territories. Stated margin of error no more than 5% at a 95% confidence level and a design effect of 1.1. Asked about lacking energy, 30% said "almost always" and 37% said they felt this from time to time; together that makes 67%. This is the frequency of a subjective feeling, not a clinical diagnosis. Some 48% expected the situation in the country to improve, but the publication does not show exactly how these groups overlap.
We do not carry assessments of safety or expectations from later waves back to July. The full presentation covers several separate fieldwork periods.
KSE Institute, Social Well-being Barometer
Full report (in Ukrainian). KSE news release of October 21, 2026.
Data were collected between March and May 2026 overall; the general-population figures used in the text are labeled March in the report. The main sample comprises 1,123 people aged 18–70 in Ukrainian-controlled territory, excluding the Donetsk and Luhansk regions. It is a national opt-in online panel with a non-probability sample, weighted by age, sex and macro-region. The authors explicitly describe the results as illustrative rather than strictly representative of the general population.
Pp. 8–9 cover method and samples; p. 13, factors reducing well-being; p. 16, expectations; p. 39, teachers' plans. The 40% and 29% figures are the shares answering 6–10 on a 0–10 scale of belief in improvement. The difference is 11 percentage points, not 11%, and not the share of people with a particular combination of answers.
Teachers form a separate sample of 359 people, weighted by sex, age and macro-region. The 21% who plan to move into a field outside education do not represent all possible job changes. The question about what could change their decision was put to 107 participants planning any change of main job. The 79% and 30% figures do not apply to all 359 teachers, nor only to those intending to leave education.
The page on factors reducing well-being contains two thematic sets of questions. The infographic shows selected answers from both, without adding them up. They do not measure causal impact. Answers about attacks, power cuts and other circumstances refer to spring 2026, not to the date the article was published.
Institute of Sociology and the First of December Initiative Group, values survey
Published on November 6, 2026 (in Ukrainian). A joint nationwide telephone survey, Values of Ukrainians During the War, conducted from September 25 to October 12, 2026, among 1,204 respondents. Fieldwork was carried out by the Institute of Sociology with support from the International Renaissance Foundation.
Respondents had to choose two of six life goals. The authors assigned three to the private sphere, including the family's material well-being, and three to the supra-personal sphere. Some 49.4% combined one goal from each group. This is the original authors' typology, not our calculation, and not a scale of selfishness or altruism. Choosing goals at a single point in time does not prove that values have changed. This indicator is not included in the index.
Tracking a direct change in life priorities would require repeating the same questions in comparable samples. The current snapshots cited in the article are no substitute for such a time series.
UNDP / Ministry of Youth and Sports / Rating Group, The Impact of the War on Youth in Ukraine 2025
Publication page. Full report. Frequency tables (all in Ukrainian).
In Ukraine, 2,050 people aged 14–35 were surveyed face to face (CAPI) on September 10–21, 2025. The sample is random, stratified and multistage, and weights were applied. Occupied territories and some areas with active fighting or high mine risk were excluded. The publication on the UNDP website is dated March 17, 2026; the report file sits in the April 2026 folder. Young people abroad form a separate sample and are not included in the shares cited in the article.
P. 32 covers goals for the next five years, with up to three answers allowed. Starting a family is not the same as having children. On pp. 52–53, the base for the wish to emigrate is 2,050, while reasons for wanting to emigrate were given by 595 people, with up to three answers. None of these figures is a forecast of actual departures.
We found small discrepancies between the overall distributions in the XLSX tables and the chart in the PDF. For example, self-fulfillment is 46.6% in the table and 46% on the chart; starting or growing a business is 27.7% in the table and 29% on the chart. The public materials do not make it possible to establish whether weighting or different versions are the cause. The article consistently uses the whole-number percentages from the PDF; the XLSX data were not mixed into the index. We did not reweight the data or test correlations ourselves.
P. 21 presents results from focus groups held in November 2025. This is explanatory material, and we do not derive population shares from it.
Oleksii Viedrov, peer-reviewed article on planning horizons
Article page. Full text (both in Ukrainian). DOI 10.15407/sociology2026.01.095, Sociology: Theory, Methods, Marketing, 2026, no. 1, pp. 95–127.
Published on March 3, 2026, the article analyzes data from the 2024 Ukrainian Society monitoring survey. Fieldwork ran from June 27 to July 6, 2024, with 4,101 respondents, CATI → CAWI. The questionnaire was designed by the Institute of Sociology; fieldwork was done by Rating Group.
Pp. 99–100 report 40.2% short-term planning: "I don't plan" 19.4%, a day 9.0%, a week 6.5%, a month 5.3%. Those planning years ahead make up 19.0%. There is no comparable measurement from just before 2022. A comparison with 2013 alone cannot establish the effect of the full-scale invasion.
The article also shows that the simple association between longer planning horizons and life satisfaction disappears once other variables are taken into account. We do not conclude from these data that extending one's planning horizon will in itself improve well-being, and we make no psychological recommendations on that basis.
Methodology
MNBC Index = (KIIS + Rating Group + Info Sapiens CSI / 2) / 3. KIIS and Rating Group are converted to a 0–100 scale as 50 + (positive − negative answers) / 2; the CSI is published on a 0–200 scale and divided by two. Each component has an equal weight of 1/3.
Waves are grouped by fieldwork quarter. The main series is calculated only for quarters with data from all three sources, without interpolation. For an unfinished quarter, a preliminary estimate may carry one component forward by no more than one quarter.
This is a secondary analysis of 69 published waves without access to microdata. No confidence interval is calculated for the composite index.