Ukraine in savings mode: what Ukrainians protect to the last and what they give up first
Household consumption is growing, yet almost half of those surveyed are going to restaurants, cinemas and concerts less often. What Ukrainians protect to the last and what they give up first, according to Deloitte, Kantar, Poster, the World Bank and the NBU.

In the second quarter of 2026, Ukrainian household consumption grew by 6.9% in real terms. Yet almost half of the people surveyed by Deloitte have started going to restaurants, cinemas and concerts less often, and those who cut their spending on furniture outnumber those who increased it by almost three to one. There is no contradiction here: overall growth in consumption does not mean that every family is spending more, or that spending is up in every category.
The surveys reveal clear differences in priorities. Groceries and medicines take up a large share of the budget, while many people are cutting back on furniture, renovation and paid leisure. At the same time, some respondents still allow themselves small treats.
The studies measure cuts in spending and activity, but they do not show which purchases people have given up for good and which they have simply put off. So a drop in purchases cannot automatically be read as pent-up demand.
We brought together data for 2025–2026: surveys by Deloitte, Kantar, Gradus, the World Bank and KIIS, PrivatBank transactions, sales at 5,000 venues that use Poster, and official statistics from the National Bank of Ukraine (NBU) and on tourist overnight stays. These datasets measure different things: what people say, what shoppers do and what businesses sell. Their audiences and limitations are noted in the text and in the section on how to read these figures at the end.
Seven findings
- 84% of the monthly budget reported by respondents goes on mandatory payments, food, health and transport. Leisure gets 1% (Deloitte, late 2025).
- Groceries and medicines are the only categories where people spending more outnumber those spending less: 38% vs 21% and 36% vs 18%.
- 51% have started vacationing in Ukraine less often, 50% go to concerts less often, and 47% go to restaurants and bars less often.
- Kyiv venues in the Poster sample saw 20% fewer visits, while the average check rose by 15% compared with the same period of 2025.
- +12.7%: the increase in overnight stays on which tourist tax was paid in the first half of 2026. This measures accommodation, not what families spend on vacations.
- 31% vs 64%: the share of people who say they have to economize on education is roughly half the share who say so about electronics and appliances.
- Households in the lowest income group are about five times as likely as those in the highest to report eating less than they felt they needed: 25.4% vs 4.9% (World Bank and KIIS, Q3 2026).
Consumption is growing, but families’ means differ
According to NBU data, household final consumption expenditure in the second quarter of 2026 rose by 6.9% year on year, adjusted for inflation. In its October Inflation Report (p. 20), the NBU pointed to signs of weakening demand in the third quarter, although wages and social payments continued to support it. Preparations for winter boosted purchases of backup power equipment, medicines and fuel.
Card payments are growing too. More than UAH 1.3 trillion worth of purchases went through PrivatBank’s acquiring network in 2025, 19% more than a year earlier. This is a nominal figure: its growth may reflect not only more shopping but also price changes, a wider acquiring network and the shift from cash to cards.
People themselves describe a different experience. In summer 2025, 74% of Kantar respondents said they had given up purchases that had been routine a year earlier. At the end of 2025, Deloitte respondents were putting 84% of their monthly budget into four basic items: mandatory payments, food, health and transport. Leisure accounted for 1%.
Real growth in national consumption and a worsening situation for individual families can easily coexist. Across two survey waves in 2025–2026, the Institute of Sociology of the National Academy of Sciences of Ukraine found two poles of almost equal size. Between 19% and 23% of respondents are cutting back on food, utilities, inexpensive appliances and big-ticket purchases all at once, while another 24–25% do not need to economize on any of these.
The spending map: what people protect and what they cut
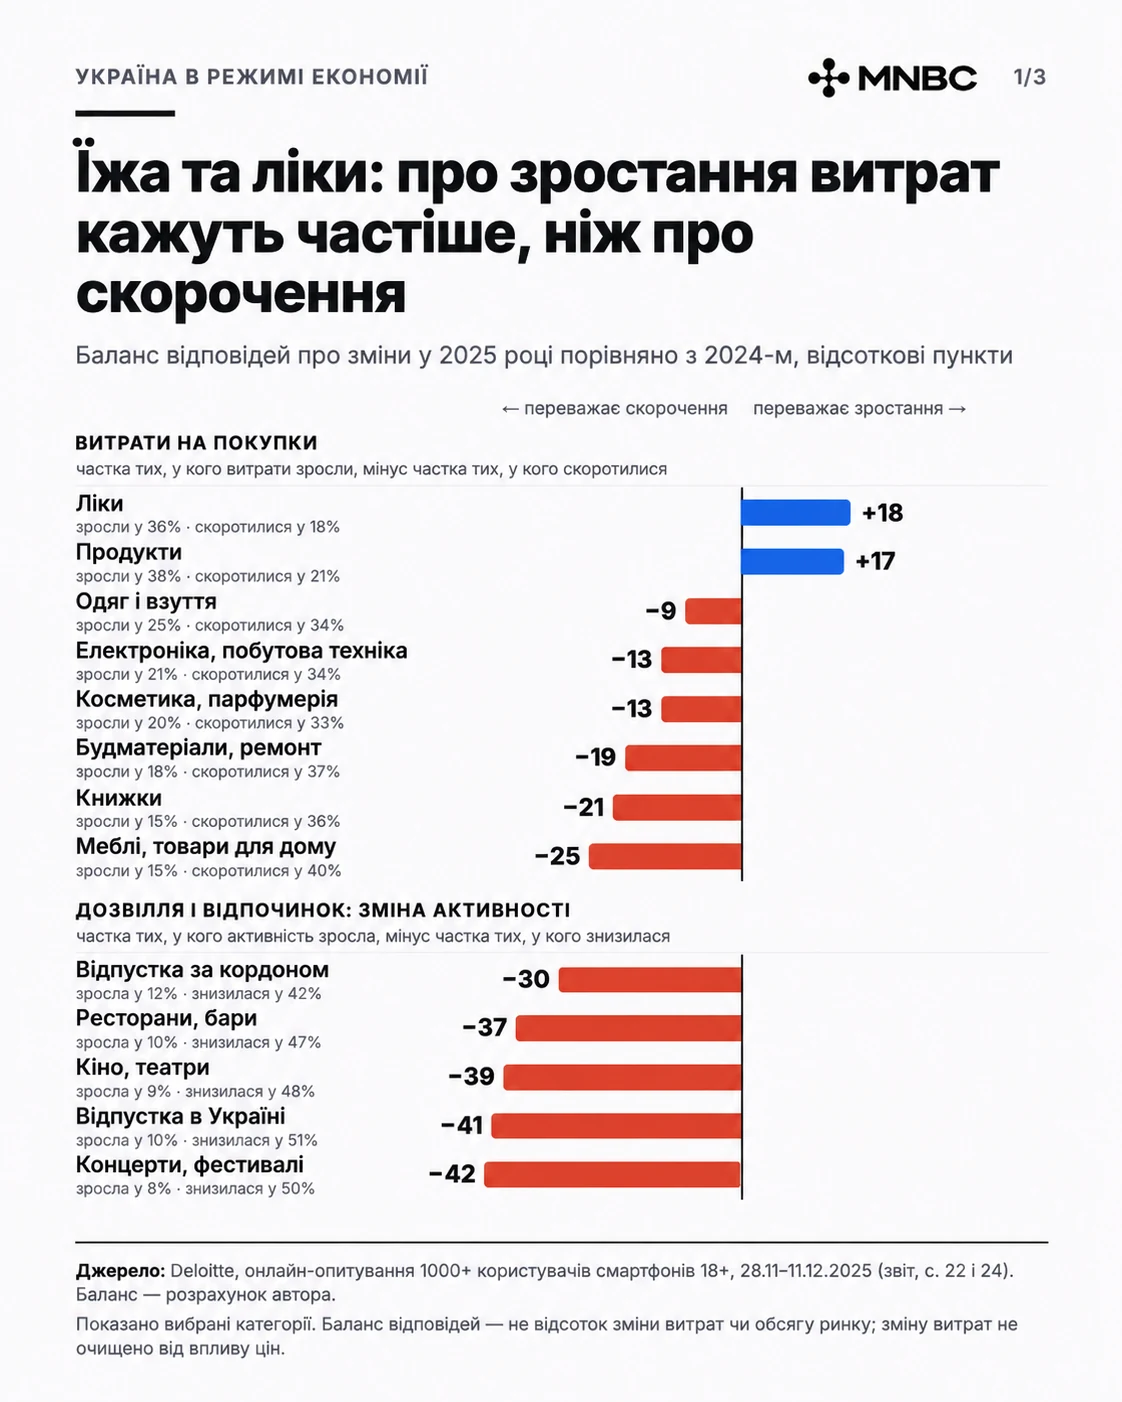
Of the eight product categories in the infographic below, Deloitte’s data show that only for groceries and medicines does the share of people reporting higher spending exceed the share reporting cuts. This is a balance of responses, not a monetary balance of the market. The deepest cuts are in furniture and household goods: 40% have started spending less and only 15% more.
The restrictions are even more visible in paid leisure than in the shopping basket. One in two respondents has started vacationing in Ukraine less often, and only one in ten more often. For restaurants, cinemas, theaters and concerts, the share reporting less activity is also several times higher than the share reporting more.
Actual payments confirm where most of the money goes. Groceries accounted for more than 40% of the value of purchases made through PrivatBank’s acquiring ecosystem in 2025.
Share of card payment value in 2025:
- Groceries — 42.4% (UAH 551.6 billion)
- Medicines and health — 8.4%
- Clothing and footwear — 7.6%
- Cosmetics and beauty salons — 7.2%
- Eating out — 6.6%
- Household goods — 5.8%
Source: PrivatBank, purchases made through the bank’s acquiring ecosystem, both in-store and online; these are not limited to PrivatBank cardholders. Cash is not included.
The most interesting picture is online. According to Promodo, in the second half of 2025 the nominal revenue of the online stores it studied grew by 37% in electronics, 39% in groceries and alcohol, and 41% in jewelry. Growth in one online segment can coexist with the belt-tightening that survey respondents describe. Possible explanations include shifts in sales channels, prices and the mix of shoppers. The study does not establish how much each of these factors contributes.
Groceries: spending more, buying smarter
Saving on groceries takes different forms. Among Deloitte respondents, 38% reported spending more and 21% spending less. A higher bill in hryvnias does not prove that people are buying more: it may reflect price changes and a different mix in the basket. For some families, the constraints affect both how much they eat and how varied their diet is.
Several Kantar studies show how people save and how they choose where to shop:
- They stick with familiar brands. 67% wait for their usual brands to go on sale when money is tight. Only 15% go purely for the lowest price.
- They shop around. About 5% of shoppers are loyal to a single chain; most buy from several. Location, product range and convenience matter, not just price.
- They plan and compare. Researchers describe shoppers hunting for deals, choosing the right pack size and weighing price against quality.
Retailers quoted in Deloitte’s commentary see the same thing from their side of the counter. Shoppers look more closely at price tags, go to discounters more often and choose the chains’ own-label products.
There is a darker side to this story. For the poorest families, the question is no longer which brand to buy but whether there is enough food. In the third quarter of 2026, almost half (49.6%) of the bottom 20% by income were eating a limited range of foods (World Bank and KIIS, p. 10). In ten frontline and border regions, 48% of families spend more than half of their income on food, and for some of them meat, fish, eggs and fruit are becoming hard to afford (KSE Institute, WFP, FAO; estimate published in May 2025).
Going out: less often, but at a higher price
According to Kantar, when money runs short, coffee, eating out and entertainment are the first things people cut.
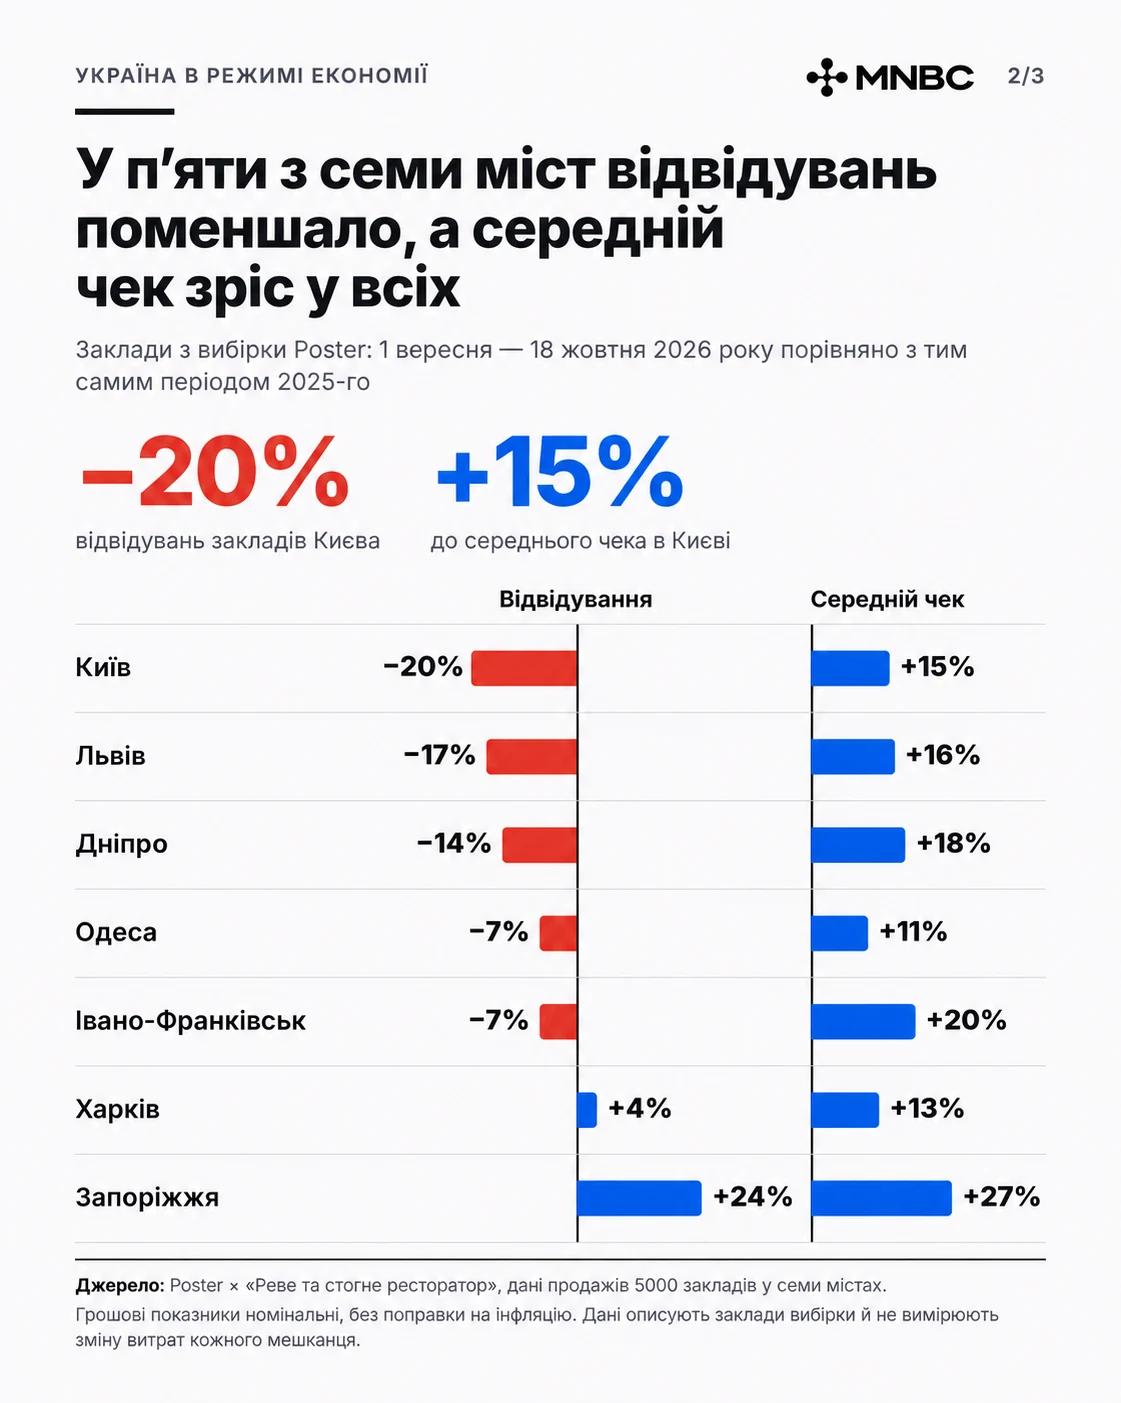
Poster and the industry outlet Reve ta Stohne Restorator compared sales at 5,000 venues in seven cities between September 1 and October 18, 2026, with the same period a year earlier. Visits fell by 20% in Kyiv, 17% in Lviv and 14% in Dnipro. Meanwhile, the average check rose in all seven cities, from +11% in Odesa to +27% in Zaporizhzhia.
In the frontline cities in the sample, visits went up: by 24% in Zaporizhzhia and by 4% in Kharkiv. The rise in the average check is nominal: it may reflect higher menu prices and changes in what people order.
Cinemas are also reporting falling attendance. Kyivkultklaster told Suspilne that attendance in September halved compared with August, and October looked much the same. The children’s audience shrank the most. Planeta Kino and Multiplex attribute the decline to the security situation, forced closures and ticket refunds.
At the same time, some respondents hold on to certain small expenses. Among subscription users, 58% keep their spending within UAH 500 a month (Kantar). In a Gradus study in spring 2026, 56% of city residents shopped online several times a month or more. The researchers note a growing need for small personal pleasures and less guilt about non-essential purchases.
These are different audiences: restaurant statistics, subscription users and Gradus respondents do not add up to a single portrait of the Ukrainian shopper.
Travel: short trips and tight budgets
At first glance, the tourism data contradict each other. In the Deloitte survey, 51% have started vacationing in Ukraine less often and 42% abroad less often. Yet the number of overnight stays on which tourist tax was paid rose by 12.7% in the first half of 2026, to 4.82 million, with UAH 186.6 million collected in tax.
These figures cannot be compared directly: the period, the audience and the unit of observation all differ. A separate survey shows what trips look like today. According to the State Agency for Tourism Development (DART), BRAND UKRAINE and Gradus, 66% of respondents aged 18–60 in cities of 50,000 people or more had traveled within Ukraine in the past 12 months. Of the 665 respondents who had traveled, 42% said a typical trip lasts 2–3 days and 33% said 4–7 days. These answers do not prove that vacations have become shorter than they used to be.
Recovery is an important reason to travel. Some 45% see travel as an effective way to recharge, and two-thirds (66%) consider domestic travel appropriate at this time.
Acceptable budgets vary. Among 840 respondents who had traveled or are planning a trip, 28% named up to UAH 1,000 a day for accommodation and food as a comfortable amount, and 17% named UAH 3,001–5,000. This is a desired budget, not actual spending, and it excludes getting there and entertainment.
By the absolute number of recorded overnight stays, the leaders are the Lviv and Ivano-Frankivsk regions, the city of Kyiv, Zakarpattia and the Kyiv region. Together they account for 71% of the total. Within this top five, the strongest relative growth was in the Kyiv region (+27.6%) and Zakarpattia (+25.4%). Some regions elsewhere grew even faster, such as the Kharkiv region (+34.2%). Overnight stays fell by 35.4% in the Sumy region and by 10.3% in the Ternopil region.
A caveat: overnight stays with tourist tax paid include foreign visitors and business trips, and part of the growth may come from hotels moving out of the shadow economy. This is a measure of demand for accommodation, not of what families spend on vacations overall.
Education: a relatively protected expense, but not for everyone
In the Deloitte survey, education is one of the categories where relatively few people say they have to economize. The category covers courses, tutoring and supplementary learning, including for adults. Deloitte found that 31% of respondents had to cut back on education, compared with 64% for electronics and appliances. Retailers in the same study also name education and children’s goods among the relatively protected categories.
Learning, however, is getting more expensive. According to BUKI and Inweb, a one-to-one lesson with a tutor cost about UAH 374 an hour on average in early 2026, roughly 16% more than a year earlier. An hour of preparation for the NMT, Ukraine’s university entrance test, costs about UAH 395 in Kyiv, UAH 334 in Odesa and UAH 313 in Lviv.
Languages are the most common reason people look for a tutor on the platform, accounting for 54.3% of requests. English, math and German together make up 41%, and hobbies 11.8%. Online lessons were acceptable in 85.2% of requests in January–July 2026, up from 81.2% in 2025.
A published survey by Slovo i Dilo and Lemur points to differences in back-to-school spending by income. In it, 30.5% spent UAH 5,000–10,000 getting one child ready for school, and 11.5% spent more than UAH 10,000. Among those with an income of up to UAH 10,000 a month per adult, 8% spent more than UAH 10,000; among those earning over UAH 40,000, 26% did. The article does not disclose the size of the parent sample or of the individual income subsamples, so these figures should be compared with caution.
In frontline regions, far from everyone manages to protect spending on education. According to an estimate by KSE Institute, WFP and FAO, 67% of families in ten frontline and border regions are cutting spending on education and health (a combined figure for the two).
Electronics: cutbacks and uneven trends across segments
Electronics and appliances are among the categories where many respondents economize. Of those surveyed by Deloitte, 64% say they have to save on them, and 29% did not buy a single device in the past year. Spending on electronics and household appliances fell for 34% of respondents and rose for 21%.
Market segments are moving differently, though. According to an NIQ/GfK review published in June 2025, sales of smartphones and laptops are about 20% below 2021 levels by value, measured in US dollars. TVs and major appliances are also below 2021 levels, while headsets, tablets and coffee machines are above them. This is neither an estimate of the number of devices sold nor a full-year result for 2026.
NIQ also noted interest in premium features: more storage, bigger screens, self-cleaning robot vacuums and washing machines with built-in dryers. According to the same review, online sales grew faster than in-store sales. A later Promodo study shows that in the second half of 2025, electronics revenue at the stores in its sample rose by 37% year on year, and the number of purchases by 19%.
Another practical need is keeping the power on. The NBU notes separately that preparations for winter 2026 increased demand for backup power. Public data do not yet make it possible to tell how much spending on electronics goes on replacing broken items, how much on keeping the lights on and staying connected during outages, and how much on non-essential upgrades.
What counts as essential and what counts as luxury
Ideas of what is essential vary between audiences: the expenses people try to hold on to include health, pets and emotional recovery.
According to Kantar (May 2026), 67% of respondents spend regularly on everyday comfort, 55% on self-care and personal development, and 49% on health. Pets are a regular expense for 35%, and leisure for 30%. When money is short, spending on medicines and pets is protected the longest, while coffee and eating out are the first to go.
Gradus and Vogue studied attitudes toward luxury among residents of large cities with above-average incomes. The results below apply only to this audience:
- 77% try to buy fewer things, but of better quality.
- When choosing fashion and beauty products, 39% named quality and durability as their priority, and 11% named prestige.
- 70% believe you should never skimp on health and medical care.
- 59% are willing to spend on improving their emotional well-being, and 52% on personal growth and new experiences, including education and travel.
- 32% buy luxury goods sparingly, 22% see them as inappropriate excess, and 18% are not interested in them. 19% see them as part of normal life.
For poor families, “essential” means something else entirely. In the bottom 20% by income, 35.7% could not afford a healthy, nutritious diet, compared with 7.9% in the top 20%. For some, luxury is a designer label; for others, it is meat, fish and fruit on the table.
Age, income, region: three fault lines
Income: a gap measured in multiples
One of the starkest gaps is about income. In the third quarter of 2026, 25.4% of households in the bottom 20% by income said that in the past 30 days they had eaten less than they felt they needed. In the top 20%, the figure was 4.9% (World Bank and KIIS). Among the poorest, 35% have no savings, compared with 12% of the wealthiest. Almost a quarter of the bottom group said they had been unable to pay their utility bills in the previous 30 days.
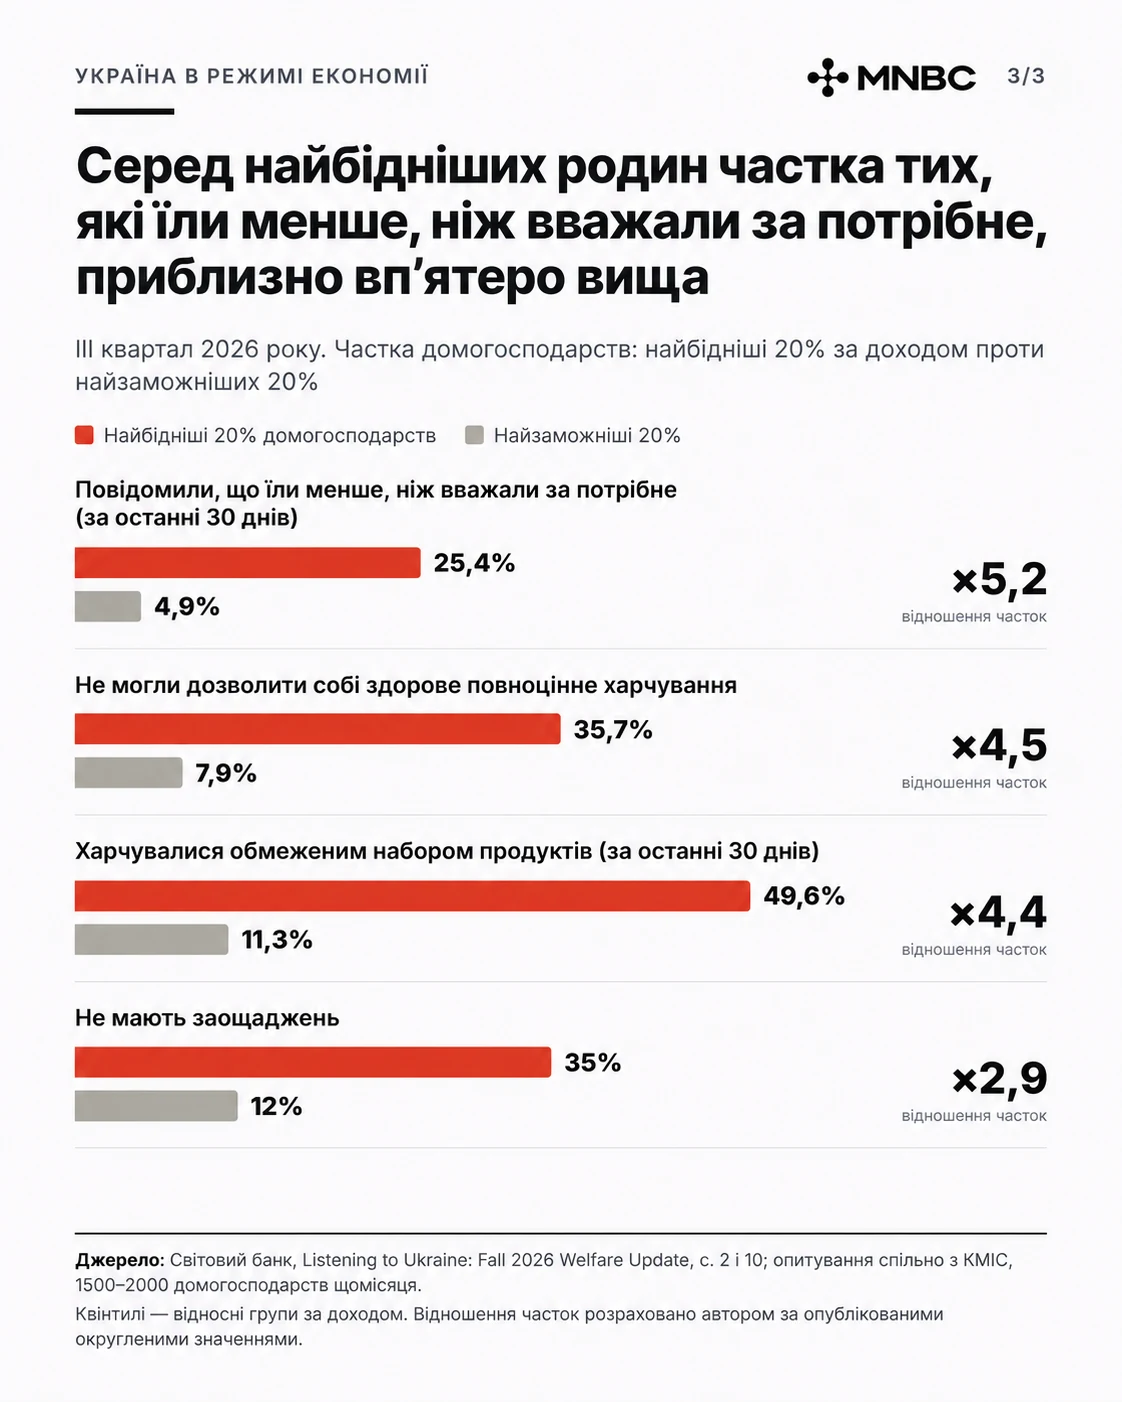
The bottom income group faces a much higher risk of going without enough food and falling behind on essential bills. At the same time, being in the top quintile does not mean being free of financial difficulties. Nor can the affluent city dwellers surveyed by Gradus and the World Bank’s income groups be treated as the same audience.
Age: absolute amounts differ
On the everyday expenses studied (comfort, self-care and leisure, as well as transport and health), respondents aged 18–29 spend an average of UAH 5,906 a month. In the 30–40 age group the figure is UAH 4,118, and in the 41–55 group UAH 4,272 (Kantar, p. 14, among those who have such expenses).
Absolute amounts do not show what share of their income people spend on themselves: income and household makeup can both skew the comparison. In a separate Gradus/Vogue study, willingness to treat oneself is more pronounced among 25- to 34-year-olds, but that sample is limited to affluent city dwellers.
Region: security reshapes shopping routines
Regional data capture different aspects of consumption. In ten frontline and border regions, about 40% of families face food insecurity and 38% are in debt (KSE Institute, WFP, FAO). Food vulnerability is higher among internally displaced people and families living closer to the front line in the east and south. The growth in tourist overnight stays in Zakarpattia and the Kyiv region reflects demand for accommodation, including from visitors, and does not measure the well-being of permanent residents.
At the same time, life in frontline cities is not only about cutting back. In Zaporizhzhia and Kharkiv, visits to venues using Poster rose in the fall, while in Kyiv and Lviv they fell. A qualitative study by Gradus describes possible ways people adapt, but it does not explain the Poster figures. Participants from Kyiv more often change their routes and postpone purchases, while those from Kharkiv have already settled into a local habit of shopping closer to home. In Lviv, people’s usual routines have stayed the same.
These are observations of 16 participants in interviews and a diary study, not city-level statistics. In this small sample, researchers saw attention shift toward essentials during periods of heavy shelling. Participants who were used to shopping online turned to delivery more often, while others might wait for the all-clear or put the purchase off. The study does not measure how common these scenarios are.
What this means for business
The data point to areas worth testing in a specific business. They do not guarantee that demand will return, and they do not establish cause and effect between all of the changes described.
For retail. Across different studies, shoppers describe sticking with familiar brands and spreading their purchases across several stores. That is a reason to check how promotions, pack sizes, location and delivery work for your own customers. Delivery should not be assumed to hold on to every customer during an air-raid alert.
For hospitality and leisure. In most cities in the Poster sample, visits fell while the average check rose. For venues, this is a reason to look separately at menu prices, order mix, repeat visits and the impact of forced closures.
For manufacturers. The Gradus/Vogue study points to quality and durability as priorities in fashion and beauty among affluent urban consumers. In electronics, several sources note demand for premium features and backup power. These observations need to be tested for a specific product and price segment.
For banks. Growth in nominal card turnover is no substitute for assessing customers’ financial health. Data on savings and utility payments show the need to distinguish between being able to afford a purchase and being ready to make it. The sources used here did not separately measure intentions to return to big-ticket purchases.
Taken together, the studies show that the pressure on household budgets is uneven. Some respondents are looking for a cheaper way to keep up their usual spending; others are cutting back on food and essential bills. On this basis, it is not possible to speak of a single Ukrainian consumer or of a guaranteed return to postponed purchases.
How to read these figures
- “Started spending more” is a share of people, not market growth. The 38% for groceries is the share of respondents, not a 38% increase in spending.
- Hryvnia amounts are nominal. Revenue, average check and card turnover also rise because of prices. The only real (inflation-adjusted) growth figures in this article are the NBU’s.
- Audiences differ. Deloitte: smartphone users aged 18+; Kantar and Gradus: urban online panels; Gradus × Vogue: city residents with above-average incomes; KSE/WFP/FAO: families in ten frontline and border regions. These figures cannot be added together or extended to all Ukrainians.
- Sales and overnight stays are not residents. Poster data describe venues that use the system, tourist tax also covers foreigners and business trips, and acquiring data exclude cash.
- Author’s calculation. “About five times as likely” is the ratio of 25.4% to 4.9%. The difference between the “more” and “less” shares in the Deloitte infographic is expressed in percentage points and does not mean the market grew in money terms.
Sources
- NBU: commentary on Q2 2026 GDP, Inflation Report, October 2026. National accounts, Q2–Q3 2026.
- Deloitte: full 2025 report, press release, 2024 wave. Online, 1,000+ smartphone users aged 18+, November 28 – December 11, 2025.
- Kantar: everyday spending. Online panel, 1,000 people aged 18–55, excluding rural areas, May 2026.
- Kantar: saving in 2025, Retail Report. July–August 2025; November 2025, 1,000 people aged 18–65.
- Gradus × Vogue: attitudes toward luxury. 600 city residents aged 18–60 with above-average incomes, August 2025.
- Gradus: shopping as stress relief, safety and shopping. 1,000 city residents, March 2026; 16 participants in 8 cities, September–October 2026.
- World Bank: Listening to Ukraine: Fall 2026 Welfare Update. Surveys conducted with KIIS, 1,500–2,000 households a month, Q3 2026.
- KSE Institute × WFP × FAO: food security in frontline regions. 10 frontline and border regions, published May 2025.
- PrivatBank: acquiring. Card payments in the bank’s network, 2025.
- Poster × Reve ta Stohne Restorator: the restaurant market in fall 2026. Sales at 5,000 venues, September 1 – October 18, 2026, vs the same period of 2025.
- Suspilne: cinemas. Interviews with cinema operators, fall 2026.
- DART × BRAND UKRAINE × Gradus: domestic tourism, overnight stays with tourist tax paid. 1,000 city residents aged 18–60, May 2026; administrative data, H1 2026.
- BUKI × Inweb: the cost of tutoring. Requests on the platform, 2025 – August 2026.
- Slovo i Dilo × Lemur: back-to-school spending. CAWI, 1,200 adults, August 25–31, 2026.
- NIQ/GfK at RAU Expo, Promodo: the electronics and appliances market, Ukrainian e-commerce. Retail audit, 2024 – H1 2025; online stores, H2 2025.
- Institute of Sociology, National Academy of Sciences of Ukraine: consumer activity in wartime. Monitoring survey, N=1,835 (2025) and N=1,001 (2026).