New Secondary analysis of open data
Coming home? Language, work, housing and family plans of Ukrainians abroad
MNBC analyzed 1,173 questionnaires from an open CES / Info Sapiens survey. We looked at how settling in abroad relates to plans to return, and compared parents' own plans with what they said their children want.
 Project leadMariia KovalchukData analyst

- Sample
- n = 1 173
- Geography
- Host countries, excluding Russia and Belarus
- Population
- Ukrainians who left the country because of the war
- Commissioned by
- MNBC initiative
- Published
- 09.11.2026
Key findings in 30 seconds
- 27%of respondents with B2–C2 language skills plan to return, compared with 55% of those who speak little or none of the language.
- 34%of those with a local job or business plan to return, versus 54% of those who reported neither.
- 36%of those living in a separate apartment or house plan to return, compared with 56% in other living arrangements.
- 17%of parents have a plan that runs opposite to the wishes of at least one child, as reported by the parent. A supplementary finding with greater uncertainty.
Speaking the language, having a local job and living in a home of one's own are all linked to weaker plans to return. Yet being settled abroad and planning to go back are not mutually exclusive.
Study at a glance
- Format: secondary analysis of open data
- Source data: CES / Info Sapiens, fifth wave of the survey of Ukrainian refugees
- Fieldwork: December 2025 to January 2026
- Sample: 1,173 completed questionnaires, with the original survey weights applied
- Coverage: Ukrainians abroad in the survey sample, excluding Russia and Belarus
- Calculations and interpretation: MNBC
- Analysis date: November 9, 2026
What we set out to answer
The overall share of people who want to return says little about their circumstances. Someone can have a job, a home and a settled routine abroad and still plan to go back. And a parent's own plan may not match what their child wants.
We went down to the level of individual respondents to answer three questions. How do different aspects of settling in relate to plans to return? Which differences hold up once other available characteristics are taken into account? And how often do a parent's answers about themselves and about their child point in opposite directions?
These are our own cross-tabulations of an open dataset. Fieldwork was carried out by Info Sapiens for the Centre for Economic Strategy (CES), with support from the International Renaissance Foundation. MNBC did not run a new survey. Dataset and documentation.
Language, work and housing
By "plan to return" we mean respondents who answered "definitely" or "probably" planning to return. Percentages are calculated for each group as a whole, including those who do not plan to return or are undecided.
Proficiency in the host-country language
- No proficiency or A1 level: 54.7% plan to return (462 respondents)
- A2–B1 level: 41.1% (468 respondents)
- B2–C2 level: 26.8% (243 respondents)
Local job or own business
- Have a local job or business: 34.3% (622 respondents)
- Did not report either: 53.5% (551 respondents)
Housing
- Separate apartment or house: 35.7% (750 respondents)
- Other living arrangements: 55.8% (423 respondents)
All figures on this page are based on open data from CES / Info Sapiens. Percentages are weighted; respondent counts are actual, unweighted numbers. Groups based on different characteristics overlap.
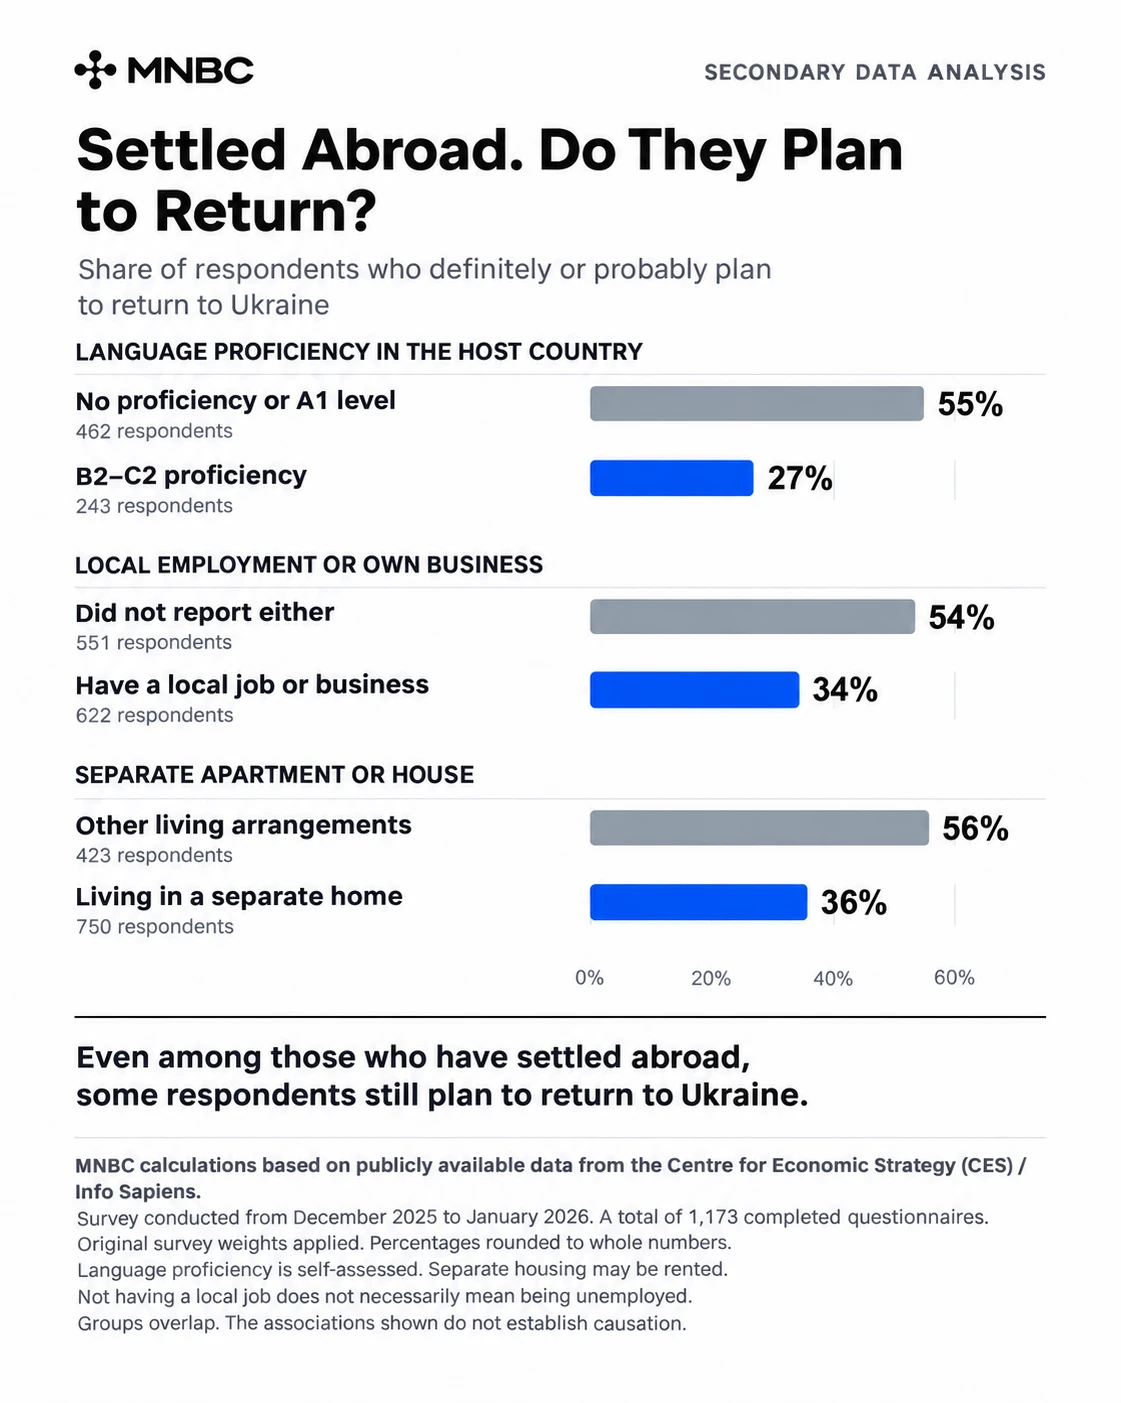
For language, the gap between the two extreme groups is 27.9 percentage points. For local employment it is 19.2 pp, and for housing 20.1 pp.
The group labels need careful reading. Language level is self-assessed. Not having a local job does not mean being unemployed: a person may be working remotely for a Ukrainian employer, studying or caring for family members. A separate home may well be rented.
What holds up once other factors are accounted for
Raw percentages can differ simply because the groups are made up of different people. Respondents who speak the language well, for example, may be younger or live in different countries. So we also used a model that accounts for age, sex, host country, children, year of departure, how respondents were recruited and the other circumstances under study.
For language, local employment and separate housing, the associations held up in this model and after correcting for the eight main comparisons.
- B2–C2 language level vs. no proficiency or A1: raw difference −27.9 pp, model-standardized difference −18.5 pp
- Local job or business vs. none reported: raw difference −19.2 pp, model-standardized difference −10.0 pp
- Separate home vs. other living arrangements: raw difference −20.1 pp, model-standardized difference −15.4 pp
A minus sign means the first group in each pair is less likely to plan a return. The model figures are descriptive standardized differences. They do not tell us how any one person's decision would change if they learned the language or found a job.
Nor do the results support a blanket rule that any kind of integration lowers the odds of return. The link with having local friends proved unstable. The large raw gap by financial situation shrinks considerably once other characteristics are taken into account. That does not mean other factors can be dismissed as unimportant.
Settling in is best understood through specific circumstances. This analysis does not produce a single measured "anchor index."
When parents' and children's answers diverge
The dataset includes 442 respondents who answered questions about children under 18. We compared their own plans with their children's wishes as reported by the parent. Where there were several children, we checked each one but counted each family only once.
In 67 questionnaires the answers pointed in opposite directions. Either the parent plans to return while at least one child, by the parent's account, wants to stay, or the parent does not plan to return while at least one child wants to go back.
The weighted share is 17.2%. The approximate conditional resampling interval is 11.7–23.6%, and the unweighted share is 15.2%. This is a supplementary, exploratory finding and is less precise than the main comparisons.
It is not a measure of family conflict. The children were not surveyed directly, and the questions differed in substance: the parent reported both their own plan and their child's wishes. Undecided answers on their own were not counted as a mismatch.
Children's wishes matter when supporting return. One parent's plan does not yet amount to a decision made by the whole family.
What is holding the undecided back
We looked separately at the 235 respondents who answered "hard to say" when asked about returning. Share of this group who cited each barrier:
- The war and fear for their own and their family's safety: 65.8%
- Power, water, heating and other infrastructure outages: 45.2%
- Better quality of life, healthcare and cities abroad: 28.6%
- Already adapted to life abroad: 26.7%
- See no future for themselves or their children in Ukraine, or have lost faith in the country's future: 26.2%
- Home or region in or near the combat zone: 25.9%
- Worried they will not find a good job in Ukraine: 22.9%
Selected categories are shown. Respondents could name more than one barrier, so the percentages do not add up to 100. They describe what respondents said and do not show how many people would return if those conditions changed.
Practical takeaways
For government and local communities, the results make the case for working with families' specific circumstances. A return offer should give clear information on housing, income, schooling and available services. The analysis itself does not assess how well any particular program works.
For employers, having a local job abroad does not close the conversation about returning. Roughly a third of respondents with such a job plan to go back. The next step is to explore timing and the specific terms of an offer, including the family's circumstances.
For international organizations, the family comparison is a reason to pay attention to children's wishes and to the transition between school systems during consultations. Decisions remain individual and call for informed choice.
For investors, these results describe needs and intentions. They do not measure budgets, willingness to buy property or appetite for investing in Ukrainian businesses. Financial decisions require a separate demand study.
Methodology
Data, sample and weights
We used the fifth-wave dataset of Ukrainian War Refugees Abroad, version 1.3. It contains 1,173 unique questionnaires collected between December 2025 and January 2026. Respondents were recruited via SMS and an online panel: 701 via SMS and 472 via the panel. This is a cross-sectional survey, so the data do not track whether the same people actually returned over time.
We applied the official weight, Weight_2. The weights sum to roughly 1,000, but the actual number of questionnaires remains 1,173. The Kish effective sample size is about 798; it reflects how uneven the weights are, not every feature of the survey design. Weighted shares were calculated as the sum of weights for the relevant answers divided by the sum of weights for the group.
System-missing values and answers flagged as missing by the authors were excluded from the relevant bases. Respondents who declined to report their financial situation were kept as a separate group. In the headline measure, "hard to say" answers were kept in the denominator. In the family comparison, children's ages were checked and each family was counted once.
Model and robustness checks
The eight main comparisons were specified before their association with plans to return was calculated. They cover language, local employment, separate housing, local friends, financial situation, a spouse or children remaining in Ukraine, living with a partner abroad, and holding other residence documents.
We used a weighted binomial regression with a logit link. In addition to these characteristics, the model controls for sex, age group, the dataset's country group, children under 18 in the household, year of departure and recruitment method. The model, with 33 coefficients, converged and is full rank. Weights were normalized to a mean of 1, and HC1 robust covariance was used.
Standardized differences were obtained by averaging the model's predicted probabilities over the actual weighted distribution of the other characteristics. A Holm correction was applied to the eight main comparisons. The conditional 95% model intervals are −27.9 to −9.2 pp for language, −16.7 to −3.3 pp for local employment and −22.4 to −8.4 pp for separate housing. These intervals are not themselves adjusted for multiple comparisons.
For the raw shares, we ran 2,000 bootstrap replications, preserving the sizes of the two recruitment groups and holding the weights fixed. We also checked models without weights, with the largest weights capped (in a supplementary calculation only), without undecided answers, and without the 12 records showing departure before 2022. The main published shares remain calculated with the original weights. In addition, 28 benchmark shares were reproduced to within rounding of the authors' published tables.
The family comparison and the breakdown of barriers among the undecided are supplementary, exploratory findings. They are not part of the confirmatory set of eight comparisons. Groups with an actual n<50 or an effective n<30 were not selected for standalone infographics.
Limitations
- These are intentions, not a forecast of moves. They can change and do not determine when anyone will return.
- The data period matters. The survey was conducted in late 2025 and early 2026. The analysis date does not make it a snapshot of November 2026.
- Coverage is limited. The sample does not include Russia or Belarus. Weights and models do not remove all coverage, self-selection and nonresponse bias.
- Association is not causation. Plans to return may shape how people settle abroad, and unmeasured circumstances may affect both.
- The intervals are conditional. Model and bootstrap intervals do not capture the full survey error and do not guarantee the stated coverage for all Ukrainians abroad.
- Some measures are self-reported. A separate home is not necessarily owned, other residence documents do not mean permanent residence, and answers about children are not a direct survey of children.
- Supplementary findings call for caution. The family estimate has a wider interval. Multiple-choice answers about barriers do not allow us to calculate the guaranteed effect of any given policy.
Sources and materials
- Hlib Vyshlinsky, Yeleazar Levchenko, CES (2026). Ukrainian War Refugees Abroad — Fifth Wave of Survey Data (2022–2026), version 1.3. Data, questionnaires, codebook and documentation.
- CES report "Ukrainian Refugees: Fifth Wave of the Survey" (in Ukrainian).
- MNBC calculation tables (Excel, 15 KB).
The source data were collected by Info Sapiens for CES with support from the International Renaissance Foundation. The dataset is published under the Open Data Commons Attribution License (ODC-BY) 1.0. The calculations and interpretation on this page are MNBC's own. We do not republish individual responses; they are available from the owner of the open dataset.
How to cite
MNBC. "Coming home? Language, work, housing and family plans of Ukrainians abroad." Secondary analysis of open data from CES / Info Sapiens, November 9, 2026. When citing, please state the survey period and link to this page.